
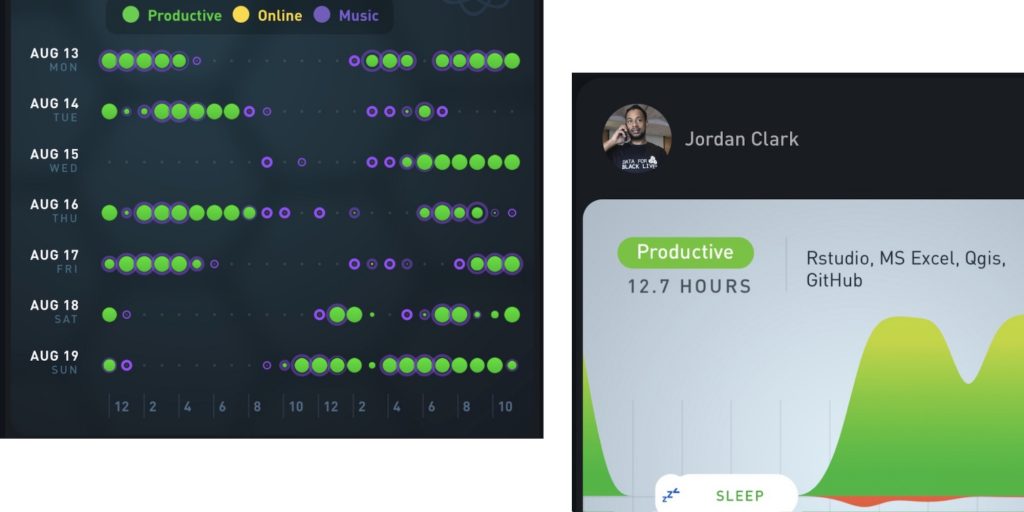
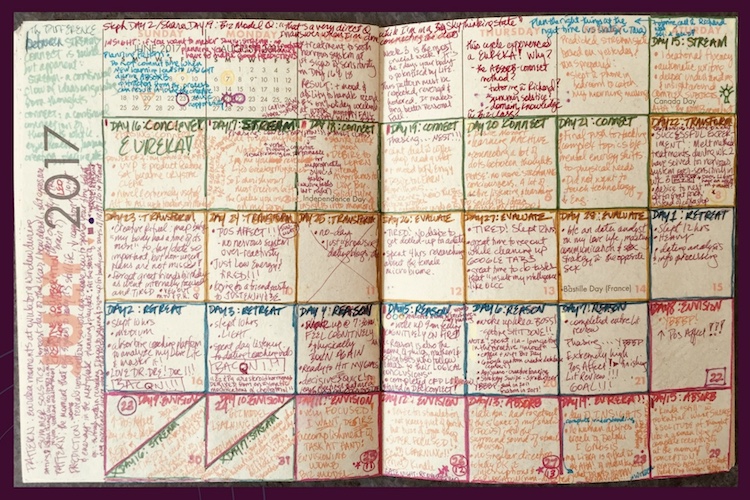
Gyroscope app visualizations of self-researcher Jordan Clark’s productivity. © Jordan Clark
While big data is being used to grab headlines, feed epidemiological models and predict the future, individual citizen scientists are quietly using wearable technologies to track their own symptoms, monitor their health and gain insight into themselves. Open Humans is building bridges and ladders through this growing mass of self-research data.
As Covid-19 makes its mark on the year 2020, this summer Makery will explore some themes of its second Open Source Body festival, scheduled for December. For this first survey, we focus on the Quantified Self movement and the Open Humans community.
Ever since March 2020 when Europe and North America went into lockdown, thousands of isolated individuals have been suffering from debilitating coronavirus symptoms at home—not severely enough to warrant continuous hospitalization, but not mildly enough to claim recovery—for several weeks, even months. Struggling alone, these Covid-19 “long-haulers” formed a number of online support groups, if only to share empirical experiences and reassure each other that they weren’t imagining their illness.
As symptoms and medical gaslighting persisted, it wasn’t long before five women—all members of the Body Politic Support Group—formed a core research team to survey, visualize, analyze and present the prolonged symptoms of 640 fellow Covid-19 patients. One of their key findings—based on mostly white, mostly female patients located mostly in the coastal U.S. and London—was that the only difference in symptoms between patients who tested positive for Sars-CoV-2 and those who tested negative (among the half who were actually tested) was more frequent loss of smell or taste in those who tested positive. Earlier testing also correlated with more positive results. More than 70% of respondents felt they were poorly or only somewhat supported by medical staff, while almost all experienced some form of social stigma. The decentralized team’s self-organized, patient-led N-of-640 research report was successfully published online on May 11, 2020.

During this same period, a number of academic research projects partnered with mainstream commercial wearables such as Fitbit, Oura Ring, Ava, Biostrap and other devices, solliciting people to track potential Covid-19 symptoms. Other institutional initiatives attracted a mad rush of both anxious and curious adopters to install ad hoc apps, eager to link their personal symptoms to the science behind the crisis.
“During the early days of the pandemic, we saw academic research projects pop up left and right that aimed to use wearable device data for predicting Covid-19 infections,” says Bastian Greshake Tzovaras, bioinformatician at the Center for Interdisciplinary Research in Paris and prolific open data advocate.
“In Germany, the Robert Koch Institute (CDC equivalent) launched an app for this, and they had so much interest that their servers crashed on the first day of the launch. But it didn’t take very long for people to voice concerns over how the data would be used, the lack of information shared and the closed-source nature of the app. There’s many layers to this, but in general most of these approaches have a very clear academic goal but no larger interest in actually delivering personal insights or learnings to participants in the short term.”
Human rights
According to Article 27 of the Universal Declaration of Human Rights adopted by the United Nations in 1948, “Everyone has the right freely to participate in the cultural life of the community, to enjoy the arts and to share in scientific advancement and its benefits. Everyone has the right to the protection of the moral and material interests resulting from any scientific, literary or artistic production of which he [sic] is the author.”
Thus, Article 27 implies the right to access scientific data, tools and knowledge, which in turn enables participation in science. It also implies the right to privacy and agency in accessing and interpreting the results of this scientific participation.
Taking these rights to heart during the zeitgeist of people using technological gadgets and apps to track various aspects of their everyday lives in the late 2000s, Wired journalists Gary Wolf and Kevin Kelly began organizing Bay Area meetups for these citizen scientists to show-and-tell their personal experiments. More than a decade later, this Quantified Self community of over 70,000 members share their personal findings in online forums, real-space meetups, conferences and exhibitions around the world, united behind the slogan “self-knowledge through numbers”—or more simply, finding personal meaning in personal data. In addition to the federating Quantified Self Labs in California, the Quantified Self Institute was inaugurated in Amsterdam in 2012.
Personal science
“When the Quantified Self movement started in 2008,” Gary Wolf recalls, “it became very much identified with the emerging wearables industry, even though it wasn’t ever really the same thing. So the wearables industry was providing tools for people to collect observations about themselves, and the Quantified Self movement was about how to reason about yourself using your own data. But more and more the wearables industry became part of a lifestyle fitness movement on the one hand, and then on the other hand, integrated into the biomedical industry. And Quantified Self very much became and stayed what we came to call ‘personal science’—what can you learn about yourself using your own reasoning power.”
Personal science may be particularly relevant at a time when even virologists and doctors are still trying to understand exactly how the novel coronavirus affects human bodies. Gary insists that every Quantified Self project is driven by an individual question.
“There have always been many, many things that you might want to know about yourself that hierarchical top-down, institutionally driven science can’t answer for you,” he says. “And the number one reason they can’t answer for you is that they don’t really care, because your questions are highly personal and highly individual, and mainstream science is about finding general answers to universal questions. But now we’re in this Covid-19 pandemic, in a situation where biomedicine doesn’t know the answer either. So all of us are trying to figure something out.”
And at a time when our personal data is already often passively collected, stored, processed and transmitted by our various digital devices, quantified self-research is an opportunity to actively reclaim and repurpose that data, privately and personally, to gain more insight into ourselves.
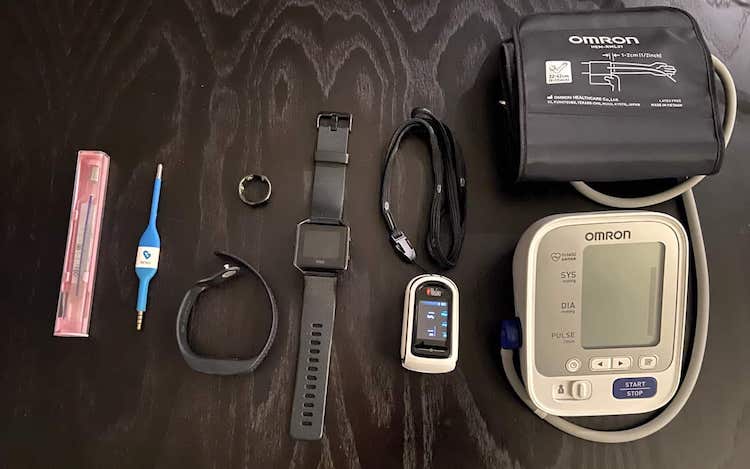
In a recent Quantified Self Show&Tell online session on June 16, 2020, Bob Troia detailed his personal methodology in tracking his own health data (body and skin temperature, resting heart rate, respiratory rate, blood oxygen saturation, blood pressure) through various wearable and commercial devices, which clearly indicated abnormal changes just before he caught a (non-coronavirus) flu in December 2019. Quantified “self-optimized” Bob points out that correlating this same personally tracked data could be used to identify potential infection of Covid-19.

Paula’s data diaries
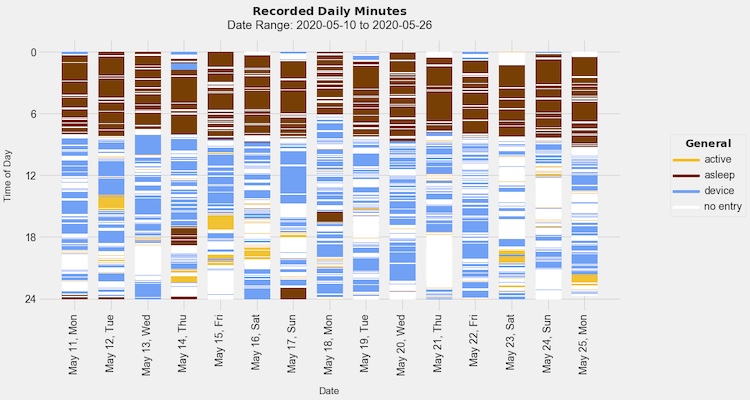
During the months-long lockdown in California, data scientist Paula Leonova charted the changes in her daily habits before and after the statewide shelter-in-place order went into effect on March 19. Paula’s open source “data diaries”, using data streams from Fitbit, RescueTime and aTimeLogger, are the technological extension of her journaling as a child, where she states her motivation as “a more automated and perhaps more objective approach to journaling—for me and for anyone else who wants to use my templates”.
“I often believe I spent x time on something or didn’t do y, but my data can tell me otherwise,” she writes. “It’s through the active process of revisiting my data and idenitifying anomalies and finding interesting patterns, that I am able to tell a more cohesive story about different periods of my life and perhaps even make some changes in behavior.”
So while more screen time, less exercise and more restful sleep while sheltering in place may be the data-driven takeaways from Paula’s personal experiment, her attractively designed, retro-colored visualization tools are shared online for anyone to plug in and learn from their own personal data streams.

Bastian Greshake Tzovaras also took inspiration from Paula’s experiment to share how the concurrent confinement in Paris affected his own daily routines. He includes a link to a notebook that anyone can run on their personal RescueTime and Oura Ring data to visualize the effects of lockdown on their own behaviors.
Shara’s muse.cycles
Dancer and inventor of muse.cycles, Shara Raqs created her own ovulation tracking method, specifically to explore the neurobiological link between hormones and the brain. As she said in an interview on Medium: “Women should have access to the same kind of predictive tech as traders in finance or physicians in healthcare to make insight-based, data-driven decisions for their performance, vitality and well-being.”
During her Show&Tell presentation this June, when asked how she was able to objectively measure creativity throughout her cycle, Shara pointed out that inventing the method was an exploratory process: “I stumbled across ecological momentary assessment before I knew what ecological momentary assessment was.” A self-taught Black woman in STEM, Shara had long been hand-calculating her hormone and cognitive patterns with pen-and-paper prototypes before she finally adopted wearables.
“I created muse.cycles because I needed a tool to more accurately observe how my ovarian rhythms affect my cognition, and I needed to integrate it with what I do in my real life,” she says. “I wanted an easy way to see all of my fertility data generated from all the femtech I use and spot the hormone patterns that help me access creative states like flow, insight and eureka! moments more often.”

After nearly a decade of investigating the relationship between menstrual phases and mental states, Shara is empowering other women to tune in to their natural creative flows by tracking their cycles. It’s also an opportunity, she believes, to scientifically reshape society’s dominant negative stereotypes of women’s menstruation and hormones.
And while Shara also observes how specific moments of acute stress in her life are just as accurately reflected in her data, she remains emotionally resilient.
“To me, creativity seems to be both a thriving skill and a surviving skill,” she continues. “Did I really get Covid-19? If my antibody test is correct and is indeed negative, then Ava has captured the effects of America’s other pandemic. The president of the American Psychological Association said in a recent article that high-profile racial incidents are taking a heavy psychological toll. My data shows that the systems of racism that the globe is now protesting against also have a real physiological toll. But as I was processing the injustices endured by my family, followed by the coronavirus, followed by economic collapse, followed by George Floyd, I see seeds of change. In every city in America. And around the globe. And it gives me renewed hope for a better future. So as the world keeps burning, keeps learning, keeps transforming and keeps fighting the good fight, I will as a radical act of positive defiance, keep tracking my muse.”
Jordan’s quantified microaggressions
A few years ago, Jordan Clark started to quantify the psychological effects of his microaggressions. Jordan self-qualifies as African-American, racially ambiguous, openly gay, diagnosed with Post Traumatic Stress Disorder, and when people ask him what he is, “They get upset with me when I say I’m human.” In his 2018 Quantified Self Show&Tell, he defines microaggressions as “small social acts of bias that oftentimes go unnoticed… with unintended consequences that have perceived reality”—questions and remarks that are seemingly harmless yet insidiously offensive.
His data-driven quantified-self journey began when he was a graduate student at Northeastern University in Boston seeking financial aid. At the time, his (white) financial aid officer called the campus police on him because she felt threatened by his “close proximity” and “word choice”. The subsequent police interrogation, which led to his forced withdrawal from classes and homelessness, was only one example of his many microaggressions.
Often, his concerns and complaints were offhandedly dismissed, especially by the police. “These are people with guns who have perceived positions of power,” he says during his presentation. “How can I get them to understand that that was a threatening incident for me, that microaggression of trying to silence me? So what I did was I started collecting data. I got really involved in Quantified Self and started collecting all these data points, understanding that in order to pinpoint how microaggressions affected my physiological state, I needed to prove it to people through my productivity or my sleep pattern, or things of that nature.” Because, he says, “Data doesn’t lie.”
He started by tracking his heart rate variability (HRV), which (along with hypertension) is directly associated with stress levels. Today, as a data researcher at Northeastern University, Jordan is still using his personal health data to tell his story of the Black experience.
i {#JMFC??????} am ?
?be selected as the @CRIatNU 2020 RiSE Data & Digital Storytelling Award Winner ->???????@SAILatNU ? my ????moments;
?a compelling????for how @Affectiva ?? will@Northeastern? achieve @PresidentAoun 2025 @robot_proof ?
???
iT-?a???? pic.twitter.com/rwe6FswhJp— Jordan Clark (@Prodigalson2025) April 13, 2020


“I leverage Gyrosope Pro’s Health Score as a proof of concept for the importance of leveraging multimodal physiological data sources in real time,” he explains in an e-mail. “The concept of a Health Score takes into account multiple metrics related to sleep, fitness, immunity, readiness, body fat, focus, workouts, meditation and nutrition. Our ability to make sense of the factors that affect our physiological state is evolving because we are getting access to precise emotion metrics and classifiers. We can pinpoint the various effects of microaggresive behaviors by adding context to HRV algorithms… I practice Metacognitive Narrative Psychotherapy, which draws upon dialogical self theory to understand the extension between how and why a microaggression caused an emotional impact.”
Dana’s artificial pancreas
Perhaps the most well-known patient-led N-of-1 research and development success story is Dana Lewis’s Open Artificial Pancreas System (OpenAPS) or Do-It-Yourself Pancreas System (DIYPS), created with her husband Scott Leibrand in 2013. As a Type 1 diabetic (T1D), Dana’s initial goal was to augment nighttime alerts when her blood sugar levels fell out of healthy range as she slept, but she and Scott eventually “closed the loop” to design a complete open source system that both monitors glucose levels and automates the pumping of insulin. The data is stored in the cloud through Nightscout, another open source system developed by T1D Ben West.
Permanent #Nightscout monitor above my iMac on a used $30 Amazon Kindle Fire. All my important stats at a glance. #Loop #WeAreNotWaiting #T1D #OpenAPS pic.twitter.com/zc0POJILTo
— Alexander Getty (@gettyalex) April 19, 2018
As Type 1 diabetes is a chronic, life-threatening disease with no known cure that unconditionally requires continuous glucose monitoring and precisely dosed insulin, patients are famously not waiting to explore, develop and adopt DIY patient-led solutions (some are even synthesizing generic insulin). According to OpenAPS, as of May 11, 2020, “more than (n=1)*1,1896+ individuals around the world” have implemented some type of DIY closed loop system to simulate an artificial pancreas—amounting to collective real-world time and experience that dwarfs that of any industrial clinical trials.
More recently, Dana Lewis and Scott Leibrand launched the open source collaborative project CoEpi to build “a privacy-first system for anonymous Bluetooth proximity-based exposure alerting based on voluntary symptom sharing”. As pairing symptom tracking with contact tracing can be a powerful tool in controlling the spread of Covid-19 or other infectious diseases, so are voluntary participation and decentralized open data.
Quantifying Covid
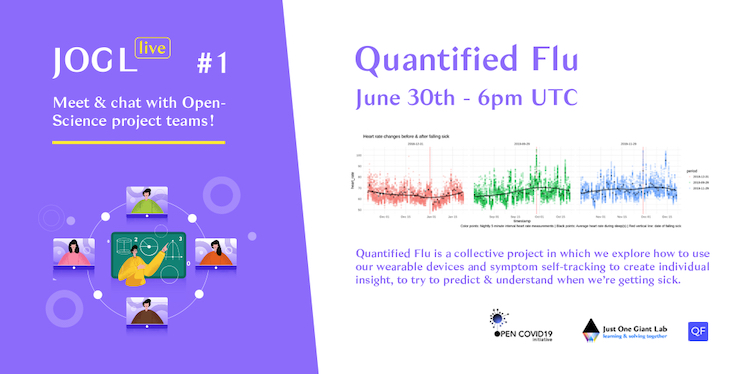
Quantified Flu is a community-initiated project that emerged from ongoing questions in the Quantified Self forums, followed by a community call where people wondered if data from their wearables could be used to predict infections in general, and Covid-19 in particular. The discussion was soon expanded and formalized by Open Humans: a sister community of self-researchers, a shared online repository for managing personal data and a resource of open tools to analyze it.
Managed by Bastian Greshake Tzovaras and Mad Price Ball, co-founder of Open Humans, Quantified Flu enables Open Humans community members to generate a timeline of their wearable device data, supplemented with a daily commented symptom report and/or diagnosis. The result is a visualized experience that is both quantified and qualified, for personal analysis. Individuals who report illness at any point also have the option of sharing their aggregated and de-identified data with academic researchers and the rest of the community for further studies.

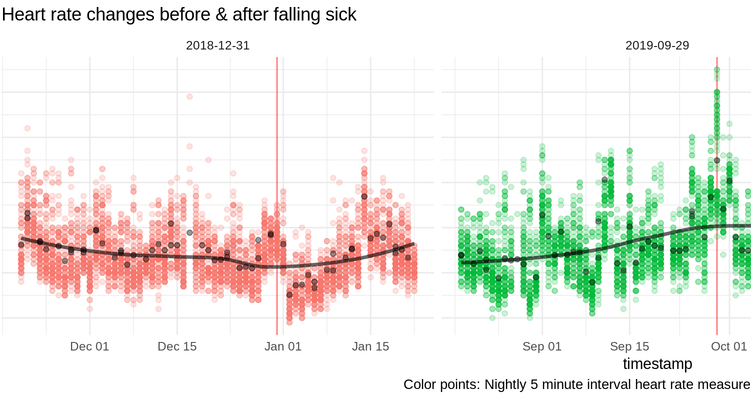
If sudden changes in resting heart rate and other biometrics are known to be associated with the onset of sickness, comprehensively tracking one’s own health condition and interpreting all the correlated data can be a daunting task for the uninitiated.
“With Quantified Flu we’re trying to lighten this burden, by giving people a way to easily collect their own data and visualize/analyze it,” says Bastian. “While the pandemic might trigger people to be interested in collecting and sharing the data, turning that into self-research is still really hard today.”
The Quantified Flu project now counts over 150 participants regularly tracking their symptoms, with about half opting to make their entire symptom reports publicly available. It currently accepts data from Fitbit, Apple Health, Google Fit, Oura Ring and Garmin wearables, while the dedicated Slack channel #proj-quantifiedflu has more than a hundred members.

By quantifying their experience, imagine how much more empowered Covid-19 long-haulers in particular could be to convincingly communicate their condition to medical staff—not to mention the valuable insight they could gain into their own physical and mental health, within the context of an open community of peers. And if they choose to share their data, their contribution would in turn enrich the self-research data commons.
“We see Quantified Flu as being complementary to purely academic research projects that are working on the same or similar research questions,” says Mad Price Ball. “With Quantified Flu we want to discover the benefits to individuals more directly and immediately, together. Individuals can revisit their own data at any time, visualize it, share it with others to provide a personal learning experience.”
From Show&Tell to Share&Build
The topical and collective Quantified Flu project is only the first building block within a bigger picture of bridges and ladders to expand access to self-knowledge through personal data.
“There’s a very big need to build the participatory science, personal science, Quantified Self community,” says Gary Wolf. “Because although everybody has questions that are unique to them, the infrastructure for answering those questions is something we can share.”
“If you want to learn something,” he continues, “you need inspiration and support, as well as tools. Mainstream science focuses a lot on getting people to contribute data, because scientists are typically working in labs where they have tools and support for making discoveries. These tools include physical equipment and software, of course, but equally important are the work processes and ‘mental models’ that help them focus their effort. They have training in what it means to make a discovery, they have an intellectual context where they can estimate the interest and novelty of their research, and a standard format for reporting their results and judging their value. People making their own discoveries with their own data don’t have these templates to work from.
“I think the Quantified Community has lasted because it fills this need: you can see what other people are learning and it helps you make your own discoveries. We are extending this through our collaboration with Open Humans and support for their work building technical infrastructure for sharing visualizations, as well as governance for data storage and management.”

At the same time, Open Humans is undergoing a redesign and restructuring in order to build a larger ecosystem for commons-based peer-production.
“Making it easier to build on previous work requires a variety of factors,” Mad explains. “Communication and disseminating existing knowledge (you have to know about it), access to the tools or code they used (you have to be able to do it too), and flexibility/modularity in those things (you have to be able to adapt it for your own use). The ability of people to make truly community-created group projects requires a thriving community of people able to do individual projects. That’s how other peer-production ecosystems often work: people write open source code to solve their own problem, and then that grows when it becomes apparent that it solves problems for other people too.”
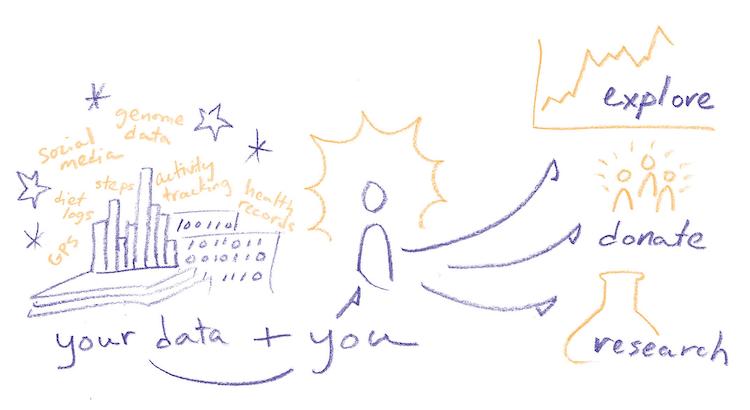
The Open Humans community currently has about 9,000 members, securely manages data commons (uploaded from commercial wearables, genetic testing companies such as 23andMe, Twitter, Google location and search history, Nightscout…) and offers dozens of tools to explore that data, including Quantified Flu.
Personal Data Notebooks enable Open Humans members to visualize and analyze their own data through a user-friendly plug-and-play web interface. They range from Bastian’s comparison between your Twitter posts and your local weather, to Mad’s analysis of tremor frequency based on accelerometer data, to Paula’s retro data diary of how you spent your time each day.
So what are we waiting for?
Jordan Clark believes that the ongoing health crisis is an opportunity for openness in self-research: “The Quantified Self movement is a part of our evolutionary process as a species, and the Covid-19 pandemic is a prime example of need. If more people participated in the Quantified Self movement, I think we would see more willingness and openness to sharing personal data for the good of humanity.”
At the time of writing, Bastian Greshake Tzovaras is in Le Pré-Saint-Gervais, France, where the weather is cloudy at 20˚C. His body temperature today is 0.02˚C lower than yesterday. Today he slept 6.17 hours, took 43 steps, and recently danced to Heart of a Dog by The Suitcase Junket. His phone is 82% charged and is currently unplugged.
Last year, Bastian also co-authored a scholarly article titled “The Personal Data Is Political”, in which he highlights science’s systemic bias due to a striking lack of ethnic, cultural and economic diversity within shared datasets, notably in the fields of neuroscience and genetics. He concludes: “It is up to us, the generators of data and the people sharing data to work on changing this, ensuring that the promise of personalized medicine is equitable.”
Well beyond biomedicine, the Quantified Self movement shows us that inclusiveness begins with small data, just as social justice begins with self-awareness, on our endless quest for both world peace and self-knowledge.
“Abolish Big Data” declares Yeshimabeit Milner, founder of Data for Black Lives. She writes: “The work of making data a tool for social change instead of a weapon of political oppression is the work of culture change. Spiritual change. It is about changing ourselves—rejecting the programming imposed on us, transforming who we see as experts, and as humans. […] It is about mobilizing and empowering a multiracial, multi-generational, interdisciplinary movement with the skills, empathy and ability to create a new blueprint for the future.”
More information on Quantified Self, Quantified Flu and Open Humans