
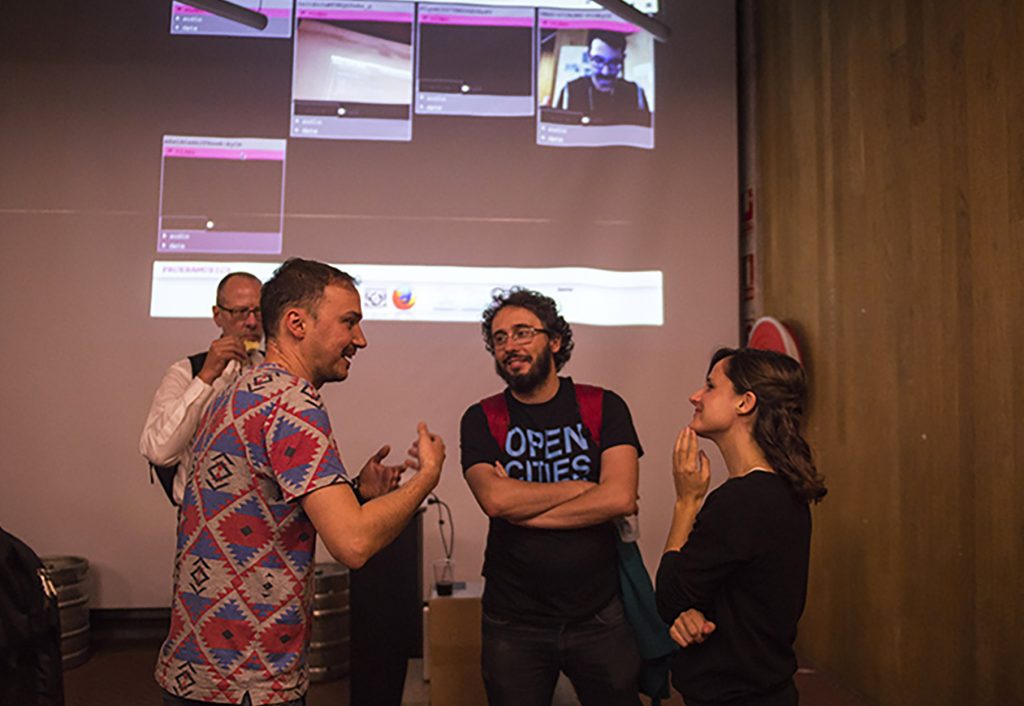
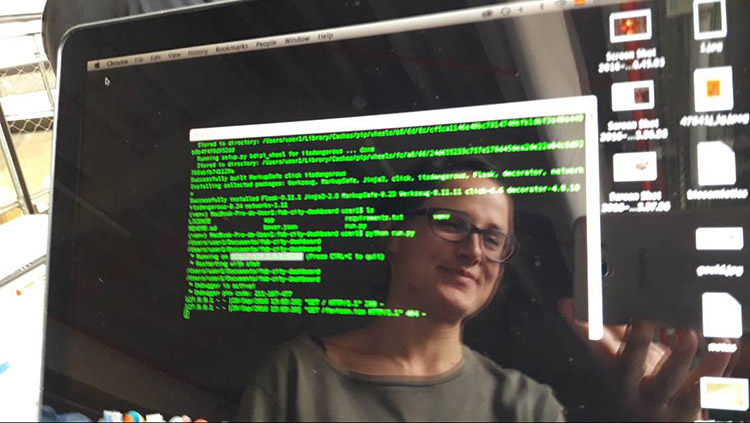
At Medialab Prado, during Visualizar, two of the three coder-makers of Fabcity Dashboard: Massimo Menichinelli (beard) and Mariana Quintero (Fablab Barcelona). © Medialab Prado
Do fablabs help big cities to become resilient? How can we measure what the movement brings to urban development? Sent to Visualizar by Ping and Makery, developer Julien Paris spent ten days in Madrid working on the Fabcity Dashboard.
Madrid, special report
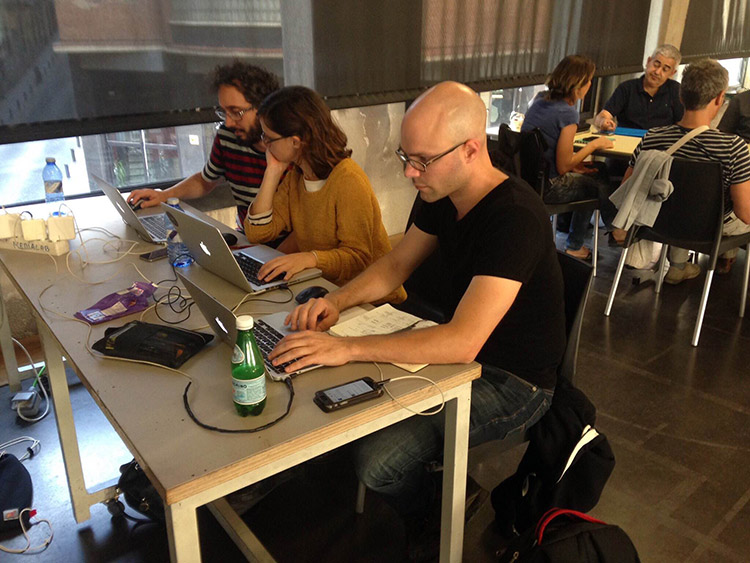
Visualizar 2016 at Medialab Prado in Madrid ended on October 5, 2016 after ten days of talks, workshops, encounters, good humor, and especially, intensive development of applications that challenge how we use open data.
Massimo Menichinelli and Mariana Quintero (both from Fablab Barcelona) and myself (sent by Makery and the nonprofit Ping for their joint medialab collaboration) worked together on Fabcity Dashboard, a project that invites people to think about what fablabs can bring to the economy of cities, as well as larger questions on the changes taking place in these territories in the coming decades.

A tool for fablabs and cities in transition
Fabcity Dashboard, proposed by Tomas Diez, director of Fablab Barcelona, is part of the Fabcity initiative. The idea was for Madrid to open the dialogue on the role of labs (fablabs, hackerspaces, biolabs, livinglabs, etc.) in the future development of cities (envisioned to be fabcities) on a global scale. This, however, poses its own profound conceptual and methodological problems.

This project is based on the fact that cities will soon be facing a number of risks related to climate, energy, the economy and demographics. In the field of contemporary scientific research in geography or economics, we identify the factors that allow cities to better resist these upcoming crises, thus favoring their resilience. According to these publications, the identified factors or their corresponding indicators range from people’s level of education, to urban industrial fabric, to quality of life… While there are in fact aggregate indicators to measure urban resilience, it may be risky to conclude that there is a consensus among the academic field. This poses the first conceptual problem: What is the model for resilience, and which indicators to use?
Parallel to the phenomena of urban mutations, news ways of producing, collaborating and sharing are being developed in third-spaces.
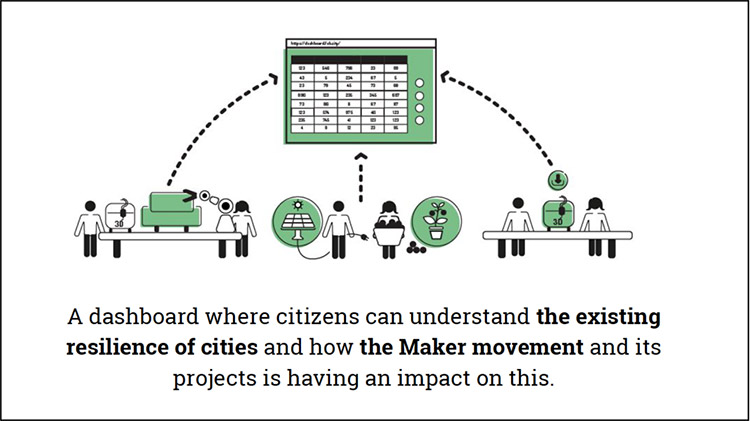
The hypothesis at the heart of the Fabcity Dashboard is that fablabs represent an avant-garde movement for new citizen-oriented, eco-conscious models of development.
Here, we test on a micro scale the potential foundations for the cities of tomorrow—cities based on the collaborative and sharing economy, as well as decentralized, relocalized forms of agricultural and industrial production, a concept referred to in Fabcity documents as “data in/data out”.
Then there is the second conceptual problem: Should we only include open and citizen fablabs? Should we include other third spaces such as hackerspaces and livinglabs and consider them all as (eco)systems of key players?
In Madrid, we had two objectives: first, to examine the concepts of a very broad issue; second, to develop a rough data visualization tool, through both statistics and maps, where we could cross-analyze existing open data on labs with indicators of global, national and urban development.
Ten days of research-action
A 10-day workshop was hardly enough to achieve this. Still, this experience was necessary in order to get an idea of the breadth of the project: define concepts such as fabcity and urban resilience, identify and examine sources of open data, choose relevant indicators for this stage, develop a prototype web application and its technical modalities, define one or more expected modes of narration for the application… and finally, prepare a presentation for the opening of the Open City Summit.

Fablabs, part of a larger ecosystem
We chose to consider only the fablabs listed on fablabs.io, mainly for practical reasons. A functional API allows us to use basic data on hundreds of fablabs (location, projects, etc). Identifying these avant-garde digital fabrication spaces will lead us to take into account their diversity and think of them as belonging to ecosystems of actors. For example, Open Labs’ White Paper (in French) suggests ways of rethinking the categories of hackerspace or fablab.
Choice of indicators
How to identify indicators that are relevant to the economic and social development of cities that have potential for urban resilience? We chose to use the aggregate indicators produced by the OECD to develop a beta version of the application, if only to test the techniques that source open data via API and pull them into mapping tools (Leaflet). A critical approach to choosing indicators is essential. We cannot address the role of fablabs in the urban industrial economy and other prospectives by simply adopting existing indicators, we must rethink industrial and economic models. Individuals such as Michel Bauwens are making practical suggestions in this direction.
There is another, more trivial, problem with using open data on a global scale—the danger of homogenizing them. Trying to define a common methodology on a global scale means being able to compare countries, regions, cities, and finally, labs. Using data from websites such as fabcity.io or the OECD’s site, which aggregate scattered data, partially resolves the problem for a beta version, but implies total confidence in the quality of the sources and their own methodologies.
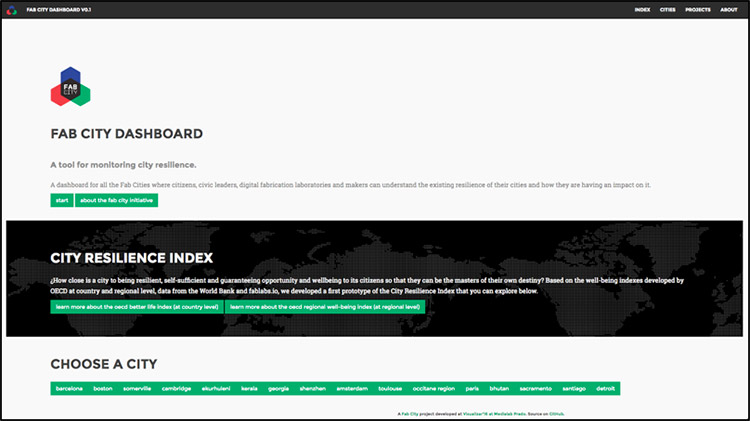
Functions of the Fabcity Dashboard
– Map tool to visualize information about the territories (population density, GDP, etc.) and the fablabs (location, number of registered projects…);

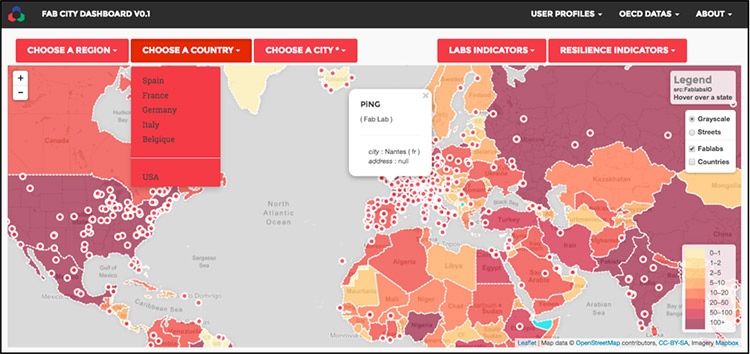
– Tools to represent qualitative and quantitative statistics on territories or fablabs (quality of life, education…) ;
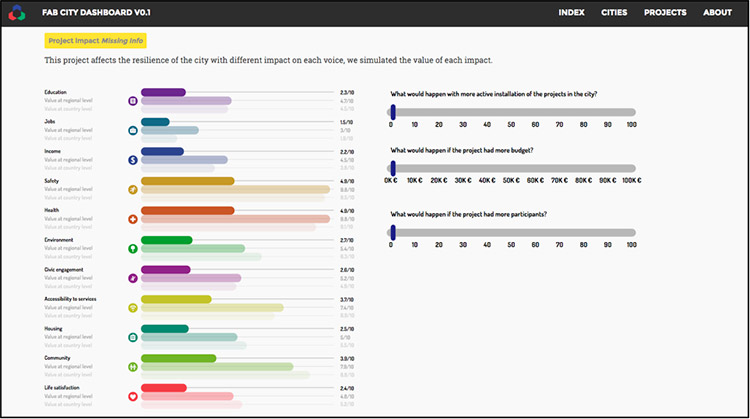
– Tools for prospective—of which I am most critical—allow you to make hypotheses on the role of fablabs in the general economy of the territory: a cursor poses the hypothesis that an increase in the number of projects led by a fablab has a direct impact on quality of life within the city.

Users of the Fabcity Dashboard
Diagnostic tool, educational aid, networking platform for key players? It depends on whether we consider the Fabcity Dashboard as serving experts, citizens or lab communities. Instead of choosing, Mariana Quintero and I insisted that the Fabcity Dashboard should be everything at once—it must serve everyone and offer all the tools for rethinking the role of labs in tomorrow’s world, as long as the information is editorialized. We need to find different narrative modes, depending on whether our profile is citizen or expert. Unfortunately, this aspect is not yet visible in the online version of the application.
Lessons from the Fabcity Dashboard after Visualizar
Fab14, thinking together smart city and fabcity? The experiment is way ahead of the urban and climate changes of the coming decades. It’s also ahead (but less) of Fab14, which will bring to France in 2018 a large number of fablab creators and managers from around the world. At events such as these, we must present tools (technical or intellectual) that offer a global vision of the issues of the cities of tomorrow. How can we simultaneously consider a model of the smart city based on open data and a model of the fabcity based on the relocation of the industrial economy?
Pose the question of the commons and editorialize the data. The future of cities should not be reserved to circles of experts or technicians. But what can we do when understanding statistics is not intuitive, any more than reading and analyzing maps? Taking the time to editorialize the data and design the interface of applications such as the Fabcity Dashboard for very different audiences is a first attempt at a response.
Raise awareness of digital fabrication in the political sphere. While politicians and local communities express interest in the digital economy and innovation by creating labels (French Tech, to name but one), fiscal advantages (research-tax credit) or start-up incubators, their interest in the maker movement still seems timid. However, new resilient economic models should not be tested separately in incubators or fablabs but in the dense relational fabric among all digital players. The Fabcity Dashboard proposes to highlight this fabric, to show regions how important their role is in aiding the development of these ecosystems, so that their territories can resist the challenges ahead.
Under the hood
The application was developed exclusively using free and open source tools, mainly in Python and Javascript. The site architecture uses Flask and Bootstrap, and the datavisualization is programmed in D3.js and Leaflet. The databases (maps and statistics) were dynamically sourced via the API of open data portals (in this case OECD) and imported in JSON format.
Beta version of Fabcity Dashboard
The source code is accessible on Github (GPL licence), documentation (bibliography, notes, links to open databases) is accessible on demand here